
Introduction
When I transitioned from Windows to Ubuntu for my network engineering work in the data center, one of the biggest revelations was the power of command-line tools. As a data center engineer working extensively with Cisco and Huawei equipment, I spend most of my time SSH'd into remote servers and devices. GUI tools simply aren't practical when you're managing infrastructure remotely.
In this multi-part series, I'll share the essential CLI-based Linux tools that have become indispensable in my daily workflow. Whether you're managing SD-WAN deployments, troubleshooting enterprise networks, or securing your infrastructure, these command-line tools will significantly enhance your capabilities without requiring GUI access.
This is Part 1, where we'll focus on packet analysis and network monitoring tools - all from the command line. If you have basic CCNA knowledge and some familiarity with Linux commands, you're ready to dive in!
Why CLI Tools Matter for Network Engineers
Before we jump into the tools, let me share why CLI-based tools are superior for network engineering:
- Remote accessibility - Work from anywhere via SSH without X11 forwarding
- Scriptable automation - Integrate into monitoring scripts and cron jobs
- Lightweight performance - No GUI overhead consuming resources
- Universal compatibility - Works on any Linux server, regardless of desktop environment
- Professional workflow - Matches the CLI-first approach of network devices
Now, let's explore the five essential CLI tools that form the foundation of network analysis on Linux.
Tool #1: TShark - Command-Line Packet Analyzer
What it is: TShark is the terminal version of Wireshark, providing powerful packet capture and analysis capabilities entirely from the command line. Think of it as Wireshark without the GUI.
Why you need it: When troubleshooting connectivity issues on remote servers, analyzing application behavior, or detecting security anomalies, TShark provides deep packet-level visibility without requiring GUI access.
Installation
bash
sudo apt update
sudo apt install tshark
During installation, you'll be asked whether non-root users should be able to capture packets. Select "Yes" and add your user to the wireshark group:
bash
sudo usermod -aG wireshark $USER
Log out and log back in for changes to take effect.
if any problem occurs use this commmand:
create the wireshark group automatically is to run the reconfiguration tool:
Bash
sudo dpkg-reconfigure wireshark-common
-
A purple screen will appear asking: "Should non-superusers be able to capture packets?"
-
Select Yes and press Enter.
-
This process will force the system to create the
wiresharkgroup.
Basic Usage
Capture packets on a specific interface:
bash
sudo tshark -i ens33
Capture with limited packet count:
bash
sudo tshark -i ens33 -c 100
Save capture to a file:
bash
tshark -i ens33 -w /tmp/capture.pcap
Read from a saved file:
bash
tshark -r /tmp/capture.pcap
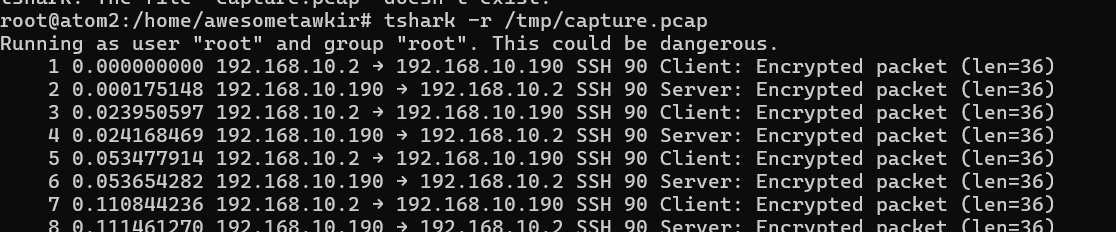
Terminal output showing tshark capturing live packets with frame numbers, timestamps, source/destination IPs, protocols, and brief packet info scrolling in real-time.
Essential Display Filters for Network Engineers
TShark uses the same display filter syntax as Wireshark. Here are filters I use daily:
Filter by IP address:
bash
tshark -i ens33 -f "host 192.168.1.100"
Filter by protocol:
bash
tshark -i ens33 -f "tcp"
tshark -i ens33 -f "udp"
tshark -i ens33 -f "icmp"
Filter by port:
bash
tshark -i ens33 -f "tcp port 22"
tshark -i ens33 -f "tcp port 443"
Capture only SYN packets (useful for detecting port scans):
bash
sudo tshark -i ens33 -f "tcp[tcpflags] & tcp-syn != 0"
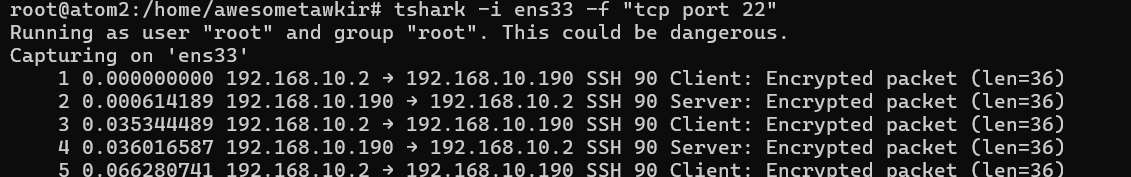
Terminal showing tshark output with a display filter applied (e.g., "tcp port 22") showing only SSH traffic with detailed packet information.
Advanced TShark Options
Display specific fields only:
bash
tshark -i ens33 -T fields -e ip.src -e ip.dst -e tcp.port
Display packet details in different formats:
bash
tshark -r capture.pcap -V  # Verbose output (like packet details pane)
tshark -r capture.pcap -x  # Include hex dump
Count packets by protocol:
bash
tshark -r capture.pcap -q -z io,phs
Extract HTTP requests:
bash
tshark -r capture.pcap -Y "http.request" -T fields -e http.host -e http.request.uri
Screenshot 3 Needed: TShark verbose output (-V flag) showing detailed packet dissection including Ethernet, IP, and TCP layer information for a single packet.
Real-World Application
When I troubleshoot connectivity issues between SD-WAN devices remotely, I use TShark to:
- Verify three-way TCP handshakes are completing
- Check for retransmissions indicating network congestion
- Identify whether packets are being encrypted properly (by checking port and protocol)
- Detect unexpected traffic patterns
Pro Tip: Use -Y for display filters (after capture) and -f for capture filters (during capture). Capture filters are faster but less flexible.
Analyzing Captured Traffic
Follow TCP streams from command line:
bash
tshark -r capture.pcap -q -z follow,tcp,ascii,0
Generate statistics:
bash
tshark -r capture.pcap -q -z conv,tcp  # TCP conversations
tshark -r capture.pcap -q -z io,stat,1 # I/O statistics
Tool #2: Nmap - Network Mapper and Security Scanner
What it is: Nmap is a powerful network scanning tool used to discover hosts, services, and open ports on a network - all from the command line.
Why you need it: For network inventory, security auditing, and detecting unauthorized services running on your network devices.
Installation
bash
sudo apt update
sudo apt install nmap
Basic Usage
Scan a single host:
bash
nmap 192.168.1.1
Scan a subnet:
bash
nmap 192.168.1.0/24
Scan specific ports:
bash
nmap -p 22,80,443 192.168.1.1
Detect operating system and services:
bash
sudo nmap -O -sV 192.168.1.1
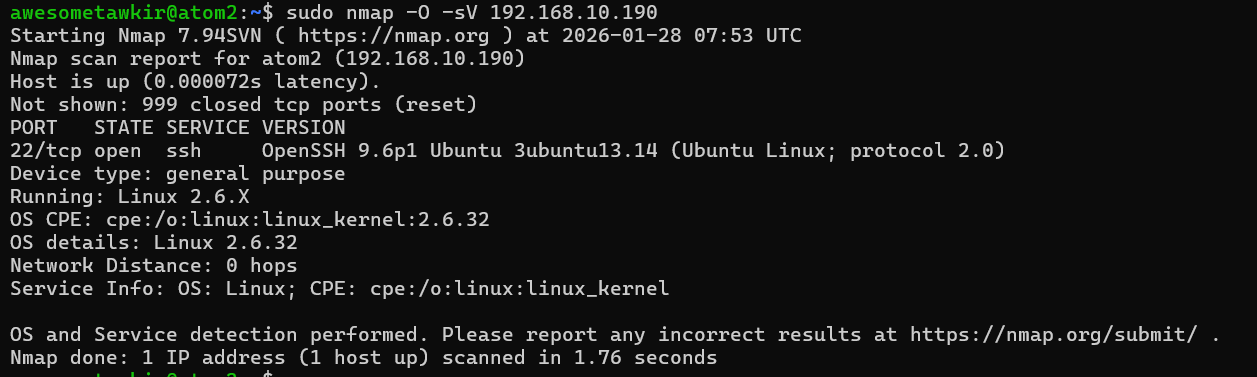
Terminal output of an nmap scan showing open ports on a target device (like a router or switch). Show ports like 22 (SSH), 80 (HTTP), 443 (HTTPS), 179 (BGP) with their states and service versions.
Advanced Scanning Techniques
SYN Stealth Scan (faster and less detectable):
bash
sudo nmap -sS 192.168.1.0/24
Aggressive scan (OS detection, version detection, script scanning):
bash
sudo nmap -A 192.168.1.1
Fast scan (top 100 ports only):
bash
nmap -F 192.168.1.1
Scan all 65535 ports:
bash
nmap -p- 192.168.1.1
Output to different formats:
bash
nmap 192.168.1.1 -oN scan.txt      # Normal output
nmap 192.168.1.1 -oX scan.xml      # XML output
nmap 192.168.1.1 -oG scan.grep     # Greppable output
nmap 192.168.1.1 -oA scan          # All formats
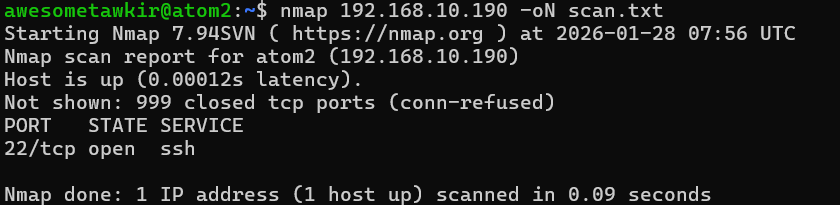
Nmap scan output with service version detection (-sV flag), showing detailed service information including versions (e.g., OpenSSH 8.2p1, Apache 2.4.41).
Useful Nmap Scripts
Nmap includes NSE (Nmap Scripting Engine) for advanced scanning:
Vulnerability detection:
bash
nmap --script vuln 192.168.1.1
SSH algorithm enumeration:
bash
nmap --script ssh2-enum-algos -p 22 192.168.1.1
SSL/TLS certificate information:
bash
nmap --script ssl-cert -p 443 192.168.1.1
Security Auditing Use Case
I regularly use nmap to:
- Verify that only authorized ports are open on routers and switches
- Detect rogue devices on the management network
- Confirm firewall rules are working correctly
- Inventory network devices before maintenance windows
- Check if Telnet (port 23) is disabled on all devices
Tool #3: Netstat - Network Statistics
What it is: Netstat displays network connections, routing tables, interface statistics, and more. It's your window into active network sessions on your Linux system.
Why you need it: To monitor active connections, identify which processes are listening on which ports, and troubleshoot connection issues.
Installation
Netstat is usually pre-installed on most Linux distributions. If not:
bash
sudo apt install net-tools
Essential Commands
Display all active connections:
bash
netstat -a
Show listening ports and associated programs:
bash
sudo netstat -tulpn
-t: TCP connections-u: UDP connections-l: Listening sockets-p: Show program name-n: Show numerical addresses (no DNS resolution)
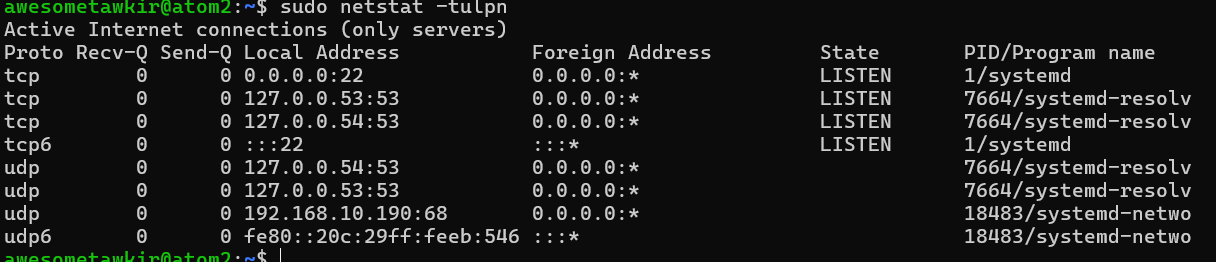
Terminal output of netstat -tulpn command showing listening services with their PIDs, protocols, local addresses, and program names (like sshd, snmpd, systemd-resolved, etc.).
Display routing table:
bash
netstat -r
# or more modern equivalent:
ip route show
Show network interface statistics:
bash
netstat -i
Display all established connections:
bash
netstat -tan | grep ESTABLISHED
Monitoring Active Sessions
See who's logged into your system via SSH:
bash
netstat -tnpa | grep 'ESTABLISHED.*sshd'
# or with more details:
sudo netstat -tnpa | grep ':22.*ESTABLISHED'
Count connections by state:
bash
netstat -ant | awk '{print $6}' | sort | uniq -c | sort -rn
```

This will show output like:
```
    45 ESTABLISHED
    12 TIME_WAIT
     5 LISTEN
     2 CLOSE_WAIT
Screenshot 8 Needed: Output showing established SSH connections with source IPs, ports, and states, demonstrating active remote sessions. Show the command: sudo netstat -tnpa | grep ':22'
Monitor connections to a specific IP:
bash
netstat -an | grep 192.168.1.100
Display connections on a specific port:
bash
netstat -an | grep :443
Advanced Netstat Usage
Continuous monitoring (refresh every 2 seconds):
bash
watch -n 2 'netstat -ant | grep ESTABLISHED | wc -l'
Find which process is using a specific port:
bash
sudo netstat -tulpn | grep :80
Display network statistics:
bash
netstat -s        # All statistics
netstat -st       # TCP statistics only
netstat -su       # UDP statistics only
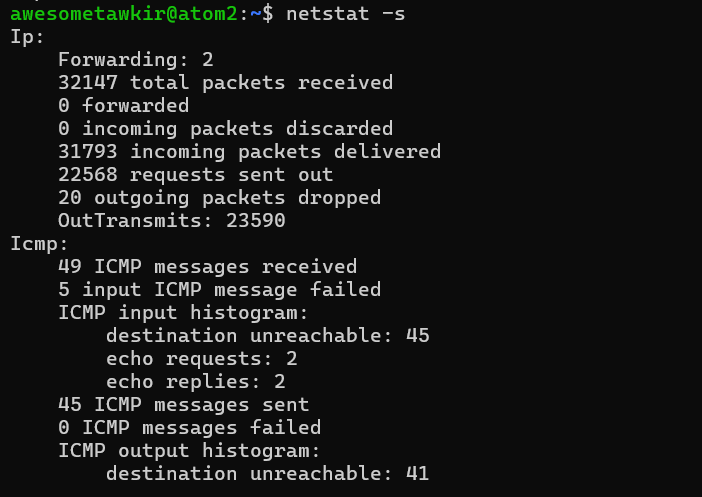
Output of netstat -s showing network statistics including TCP segments sent/received, retransmissions, failed connection attempts, and reset connections.
Practical Application
In my data center work, I use netstat to:
- Verify BGP sessions are established (port 179)
- Monitor HTTPS connections to management interfaces
- Identify connection states (ESTABLISHED, TIME_WAIT, CLOSE_WAIT)
- Troubleshoot services that fail to start due to port conflicts
- Check if SNMP (port 161) is properly listening
Troubleshooting Example:
bash
# Check if SSH daemon is listening
sudo netstat -tulpn | grep :22

# If nothing shows up, SSH isn't running
# Check service status
sudo systemctl status sshd
Tool #4: Tcpdump - Command-Line Packet Capture
What it is: Tcpdump is a powerful packet capture tool that works entirely from the command line. While TShark offers more detailed analysis, tcpdump is faster, lighter, and often pre-installed.
Why you need it: When you need quick packet captures on remote devices, or when you want a lightweight tool for automated monitoring scripts.
Installation
bash
sudo apt update
sudo apt install tcpdump
Basic Usage
Capture packets on an interface:
bash
sudo tcpdump -i ens33
Capture with more readable timestamps:
bash
sudo tcpdump -i ens33 -tttt
Capture and save to a file:
bash
sudo tcpdump -i ens33 -w capture.pcap
Read from a saved file:
bash
tcpdump -r capture.pcap
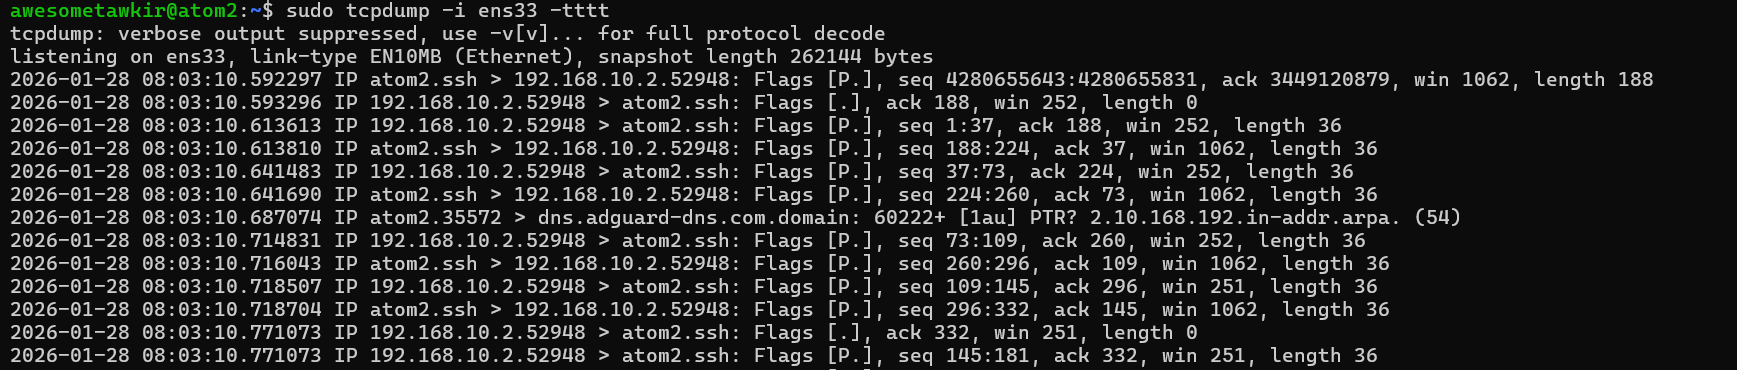
Terminal showing tcpdump capturing live packets with detailed timestamps (-tttt flag), source/destination IPs, protocols, flags, and packet details.
Powerful Filtering
Capture only SSH traffic:
bash
sudo tcpdump -i ens33 port 22
Capture traffic from a specific host:
bash
sudo tcpdump -i ens33 host 192.168.1.100
Capture traffic between two hosts:
bash
sudo tcpdump -i ens33 host 192.168.1.100 and host 192.168.1.200
Capture only SYN packets (port scan detection):
bash
sudo tcpdump -i ens33 'tcp[tcpflags] & (tcp-syn) != 0 and tcp[tcpflags] & (tcp-ack) == 0'
Capture with more detailed output:
bash
sudo tcpdump -i ens33 -v -n
-v: Verbose output (use-vvor-vvvfor more verbosity)-n: Don't resolve hostnames (faster)-nn: Don't resolve hostnames or port names
Screenshot 11 Needed: Tcpdump output with verbose flag (-vv) showing detailed packet information including TTL, IP ID, flags, window size, and options.
Advanced Tcpdump Filters
Capture traffic on specific network:
bash
sudo tcpdump -i ens33 net 192.168.1.0/24
Capture traffic NOT from a specific host:
bash
sudo tcpdump -i ens33 not host 192.168.1.1
Capture ICMP (ping) packets:
bash
sudo tcpdump -i ens33 icmp
Capture only TCP RST packets:
bash
sudo tcpdump -i ens33 'tcp[tcpflags] & (tcp-rst) != 0'
Capture packets larger than specified size:
bash
sudo tcpdump -i ens33 greater 1000
Displaying Packet Contents
Show ASCII content:
bash
sudo tcpdump -i ens33 -A port 80
Show both hex and ASCII:
bash
sudo tcpdump -i ens33 -X port 80
Capture specific number of packets:
bash
sudo tcpdump -i ens33 -c 100
Practical Tcpdump Scenarios
Monitor DNS queries:
bash
sudo tcpdump -i ens33 -n port 53
Capture only incoming traffic:
bash
sudo tcpdump -i eens33 -Q in
Capture with snaplen (limit captured bytes per packet):
bash
sudo tcpdump -i ens33 -s 96 # Capture only first 96 bytes (headers)
Rotating capture files:
bash
sudo tcpdump -i ens33 -w capture.pcap -C 100 -W 5
This creates files up to 100MB, keeping only the 5 most recent.
Why I Use Tcpdump for Quick Captures
When troubleshooting remote Cisco or Huawei devices, I SSH into a Linux monitoring server and use tcpdump because:
- It's faster and lighter than TShark for quick captures
- Often pre-installed on Linux systems
- Perfect for creating automated capture scripts
- Can be easily combined with other CLI tools using pipes
Quick troubleshooting workflow:
bash
# Capture 100 packets and analyze
sudo tcpdump -i eth0 -c 100 -w quick.pcap
tcpdump -r quick.pcap | grep SYN | wc -l  # Count SYN packets
Tool #5: Iftop - Real-Time Bandwidth Monitoring
What it is: Iftop displays real-time bandwidth usage on network interfaces in a top-like interface, showing which connections are consuming the most bandwidth - all from the terminal.
Why you need it: To quickly identify bandwidth hogs, monitor interface utilization, and troubleshoot performance issues without GUI tools.
Installation
bash
sudo apt update
sudo apt install iftop
Basic Usage
Monitor default interface:
bash
sudo iftop
Monitor specific interface:
bash
sudo iftop -i ens33
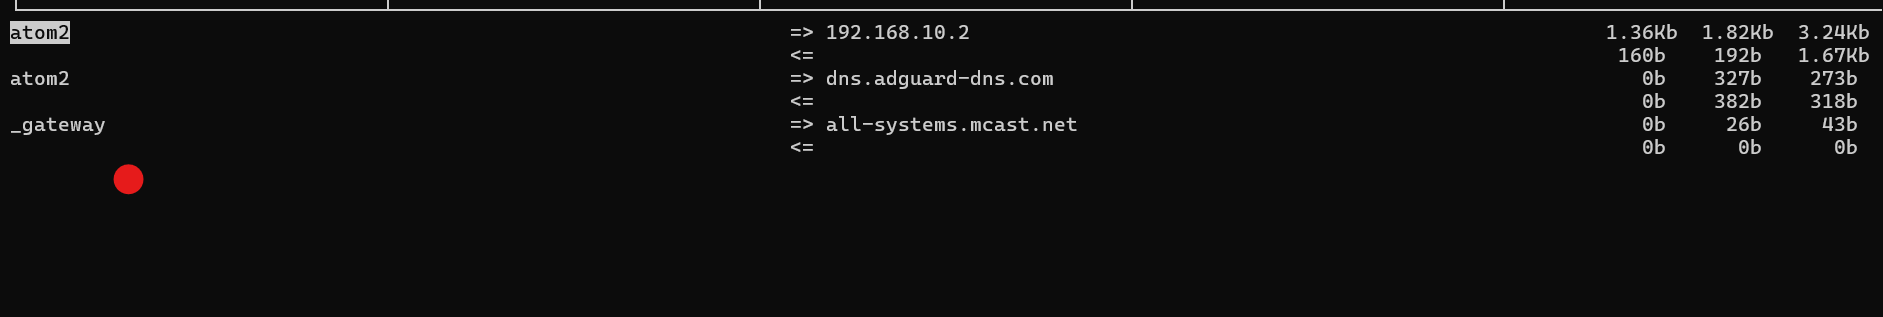
Iftop running in terminal showing active connections with bandwidth usage in real-time. Display should show source/destination hosts, current bandwidth rates (in Kb, Mb), cumulative totals (2s, 10s, 40s averages), and bandwidth bar graphs on the right side.
Understanding Iftop Display
The iftop interface shows:
- Top section: Source ↔ Destination connections with arrows
- Right side: Bandwidth usage bars showing relative consumption
- Three columns: 2 second, 10 second, and 40 second averages
- Bottom: Total bandwidth statistics (TX, RX, TOTAL)
- Arrows (=> and <=): Indicate traffic direction
Useful Command-Line Options
Show ports along with IPs:
bash
sudo iftop -i ens33 -P
Don't resolve hostnames (faster):
bash
sudo iftop -i ens33 -n
Don't resolve port names:
bash
sudo iftop -i ens33 -N
Combined (no name resolution):
bash
sudo iftop -i ens33 -nN
Filter by network:
bash
sudo iftop -i ens33 -F 192.168.1.0/24
```

**Screenshot 14 Needed:** Iftop display with port numbers and no name resolution enabled (using `-nNP` flags), showing IP addresses, port numbers, and bandwidth consumption for easier analysis in production environments.

### Keyboard Shortcuts Within Iftop

While iftop is running, use these keys:

- **n**: Toggle hostname resolution on/off
- **s**: Toggle source host display
- **d**: Toggle destination host display
- **p**: Toggle port display
- **P**: Pause display (freeze current view)
- **t**: Toggle display mode (one line, two line, three line)
- **j/k**: Scroll display up/down
- **l**: Display filter prompt
- **q**: Quit

**Using display filter:**
Press `l` and enter a filter like:
```
dst host 192.168.1.1
src host 192.168.1.100
port 443
Screenshot 15 Needed: Iftop with toggled display mode showing detailed breakdown of sent/received traffic separately for each connection pair.
Advanced Iftop Usage
Show cumulative totals only:
bash
sudo iftop -i ens33 -t -s 10
-t: Text mode (no ncurses)-s 10: Run for 10 seconds
Output to file for analysis:
bash
sudo iftop -i ens33 -t -s 60 > bandwidth_report.txt
Monitor only incoming or outgoing:
bash
# This is done via filters within iftop using 'l' key
# Example filter: "src host 192.168.1.0/24"
Real-World Monitoring Scenarios
I use iftop daily in these situations:
1. SD-WAN Link Monitoring:
bash
sudo iftop -i ens33 -P
Monitor bandwidth usage during SD-WAN failover testing to ensure traffic shifts properly.
2. Identifying Bandwidth Hogs:
bash
sudo iftop -i ens33 -nNP -o 2s
Quickly identify which IP and port combinations are consuming bandwidth.
3. Verifying Load Balancing: When testing load balancers or link aggregation:
bash
sudo iftop -i bond0 -F 10.0.0.0/8
4. Detecting DDoS or Port Scans: Multiple connections from single IP with small bandwidth each:
bash
sudo iftop -i ens33 -nN
Iftop vs. Other Tools
When to use iftop:
- Need real-time, interactive bandwidth monitoring
- Want to see per-connection bandwidth usage
- Troubleshooting specific bandwidth issues
- Need visual representation in terminal
When to use alternatives:
nethogs: Per-process bandwidth (which program uses bandwidth)nload: Simple interface-level monitoringbmon: More detailed interface statisticsvnstat: Long-term bandwidth statistics
Tool Comparison and When to Use Each
Let me share when I reach for each tool in my daily workflow:
Quick Reference Guide
TShark - Use when you need:
- Deep packet analysis from command line
- Protocol-level troubleshooting
- Specific packet field extraction
- Compatibility with Wireshark filters
Nmap - Use when you need:
- Network discovery and inventory
- Port scanning and service detection
- Security auditing
- OS fingerprinting
Netstat - Use when you need:
- Quick check of listening ports
- View active connections and their states
- Identify which program uses which port
- Routing table information
Tcpdump - Use when you need:
- Fast, lightweight packet capture
- Quick troubleshooting without analysis overhead
- Automated capture scripts
- Minimal system resource usage
Iftop - Use when you need:
- Real-time bandwidth monitoring
- Identify bandwidth-hungry connections
- Visual representation of traffic flow
- Quick bandwidth anomaly detection
Real-World Use Case: Detecting Unauthorized Access
Let me walk you through a scenario I encountered recently where all these CLI tools worked together to detect and investigate unauthorized access attempts - all done remotely via SSH.
The Scenario
I received an alert about unusual network activity on one of our Linux jump hosts used for network device management. Multiple failed login attempts were logged, and I needed to investigate whether an attacker was attempting to breach our network. I was working remotely and only had SSH access to the server.
Investigation Using Our CLI Tools
Step 1: Check Active Connections with Netstat
First, I SSH'd into the jump host and checked for any established SSH connections:
bash
sudo netstat -tnpa | grep ':22.*ESTABLISHED'
```

**Screenshot 16 Needed:** Terminal output showing netstat command with multiple ESTABLISHED SSH connections, including several from an unusual IP address (e.g., 203.0.113.50) that stands out from normal management IPs.

The output showed:
```
tcp   0   0 10.0.1.50:22        192.168.1.100:54321   ESTABLISHED 1234/sshd: admin
tcp   0   0 10.0.1.50:22        192.168.1.105:54892   ESTABLISHED 1567/sshd: netadmin
tcp   0   0 10.0.1.50:22        203.0.113.50:43891    ESTABLISHED 2891/sshd: [auth]
tcp   0   0 10.0.1.50:22        203.0.113.50:43892    ESTABLISHED 2893/sshd: [auth]
tcp   0   0 10.0.1.50:22        203.0.113.50:43893    ESTABLISHED 2895/sshd: [auth]
I immediately noticed multiple connections from 203.0.113.50 with [auth] status - indicating authentication attempts in progress. This IP wasn't part of our authorized network ranges.
I also checked the connection count:
bash
netstat -ant | awk '{print $6}' | sort | uniq -c | sort -rn
This revealed an unusually high number of TIME_WAIT and SYN_RECV states, suggesting rapid connection cycling - classic brute-force behavior.
Step 2: Monitor Real-Time Activity with Iftop
I launched iftop to see real-time bandwidth patterns:
bash
sudo iftop -i eth0 -nNP
Screenshot 17 Needed: Iftop display showing the suspicious IP (203.0.113.50) with multiple port 22 connections. The bandwidth should be relatively low per connection but showing many concurrent connections - a hallmark of SSH brute-force attempts.
The iftop display showed:
- Multiple connections from 203.0.113.50 → 10.0.1.50:22
- Very low bandwidth per connection (few Kb/s)
- Rapid cycling of connections (appearing and disappearing)
- Pattern typical of automated scanning/brute-force
This confirmed active attack in progress.
Step 3: Identify the Threat with Nmap
I wanted to profile the attacker's system, so I scanned back:
bash
sudo nmap -A -T4 203.0.113.50
Screenshot 18 Needed: Nmap scan results showing the attacker's open ports and services, possibly revealing it's a compromised Linux server with services like SSH, HTTP, or other indicators of a botnet node.
The scan revealed:
- Multiple open ports including 22, 80, 445
- Linux OS (likely a compromised server)
- SSH service running (suggesting it might also be a victim)
- No reverse DNS or generic cloud hosting PTR record
Step 4: Capture Attack Traffic with Tcpdump
I started capturing packets from the suspicious IP for evidence:
bash
sudo tcpdump -i eth0 -n host 203.0.113.50 -w /tmp/attack_$(date +%Y%m%d_%H%M%S).pcap
I let this run in a screen session so it would continue capturing even if my SSH session dropped.
After a few minutes, I stopped it with Ctrl+C. The file showed:
bash
ls -lh /tmp/attack_*.pcap
-rw-r--r-- 1 root root 24M Jan 28 14:32 /tmp/attack_20260128_143200.pcap
24MB in just a few minutes - clear indication of high-volume activity.
Step 5: Quick Analysis with Tcpdump
I did some quick analysis of the captured traffic:
bash
# Count total packets
tcpdump -r /tmp/attack_20260128_143200.pcap | wc -l
Result: 18,453 packets in a few minutes!
bash
# Look for SYN packets (connection attempts)
tcpdump -r /tmp/attack_20260128_143200.pcap 'tcp[tcpflags] & (tcp-syn) != 0' | wc -l
Result: 8,234 SYN packets - massive connection attempt volume.
bash
# Check if it's scanning other ports too
tcpdump -r /tmp/attack_20260128_143200.pcap -n | grep -v ':22' | head -20
Screenshot 19 Needed: Terminal showing tcpdump output analyzing the captured pcap file, displaying connection attempts with SYN flags and various destination ports, revealing a port scan pattern.
This revealed the attacker was also scanning ports 23 (Telnet), 3389 (RDP), and others - looking for any vulnerable service.
Step 6: Deep Analysis with TShark
For more detailed protocol analysis, I used TShark:
bash
# Extract statistics about the attack
tshark -r /tmp/attack_20260128_143200.pcap -q -z conv,tcp
This showed multiple short-lived TCP conversations - each attempting to establish SSH connections.
bash
# Look for successful authentications (if any)
tshark -r /tmp/attack_20260128_143200.pcap -Y "ssh.message_code == 52"
Fortunately, no successful authentications were found.
bash
# Analyze timing between connection attempts
tshark -r /tmp/attack_20260128_143200.pcap -Y "tcp.flags.syn==1 && tcp.flags.ack==0" -T fields -e frame.time_relative -e ip.dst -e tcp.dstport | head -20
Screenshot 20 Needed: TShark output showing the timing analysis of SYN packets, demonstrating the rapid-fire nature of the brute-force attack with connections attempted every fraction of a second.
This revealed attempts every 0.1-0.2 seconds - clearly automated.
Step 7: Check Authentication Logs
While not a network tool, I correlated with system logs:
bash
sudo grep "Failed password" /var/log/auth.log | grep "203.0.113.50" | tail -20
This showed hundreds of failed login attempts with common usernames like:
- root
- admin
- administrator
- user
- test
- oracle
- postgres
Classic dictionary attack pattern.
The Resolution
By combining these CLI tools remotely via SSH, I was able to:
- Identify the unauthorized access attempt in real-time (netstat)
- Visualize the attack pattern (iftop)
- Profile the attacker's system (nmap)
- Capture evidence of the attack (tcpdump)
- Analyze the attack methodology in detail (tshark)
Immediate Actions Taken
1. Block the attacker immediately:
bash
sudo iptables -A INPUT -s 203.0.113.50 -j DROP
2. Check for any successful logins:
bash
sudo grep "Accepted" /var/log/auth.log | grep "203.0.113.50"
Fortunately, none found.
3. Harden SSH configuration:
bash
sudo nano /etc/ssh/sshd_config
Changes made:
- Disabled root login:
PermitRootLogin no - Disabled password authentication:
PasswordAuthentication no - Limited users:
AllowUsers admin netadmin - Changed default port:
Port 2222
4. Installed fail2ban:
bash
sudo apt install fail2ban
sudo systemctl enable fail2ban
sudo systemctl start fail2ban
Configured to ban IPs after 3 failed attempts.
5. Implemented geo-blocking: Since all our management traffic comes from specific countries, I implemented geo-IP blocking:
bash
# Using ipset and iptables to block entire country ranges
# (Implementation details omitted for brevity)
6. Set up monitoring alerts: Created a simple script to alert on suspicious activity:
bash
#!/bin/bash
# /usr/local/bin/ssh_monitor.sh
THRESHOLD=5
COUNT=$(netstat -tn | grep ':22.*SYN_RECV' | wc -l)
if [ $COUNT -gt $THRESHOLD ]; then
    echo "Warning: $COUNT concurrent SSH connection attempts" | mail -s "SSH Alert" admin@example.com
fi
Added to cron:
bash
*/5 * * * * /usr/local/bin/ssh_monitor.sh
Lessons Learned
This incident reinforced several important practices:
- CLI tools are sufficient - I handled this entire incident remotely with only SSH access
- Layered monitoring - Each tool provided a different perspective
- Capture first, analyze later - Starting tcpdump early preserved evidence
- Prevention is better - Should have had fail2ban from the start
- Documentation matters - Having standard troubleshooting procedures saved time
Creating Your Own Troubleshooting Scripts
One advantage of CLI tools is that you can combine them into powerful scripts. Here are some examples I use:
Network Monitoring Dashboard Script
bash
#!/bin/bash
# network_dashboard.sh - Quick network status overview

echo "=== Network Dashboard ==="
echo

echo "Active Connections:"
netstat -ant | awk '{print $6}' | sort | uniq -c | sort -rn
echo

echo "Top 10 Connections by IP:"
netstat -ant | awk '{print $5}' | cut -d: -f1 | sort | uniq -c | sort -rn | head -10
echo

echo "Listening Services:"
sudo netstat -tulpn | grep LISTEN
echo

echo "Interface Statistics:"
netstat -i
Screenshot 21 Needed: Output of the network_dashboard.sh script showing the consolidated view of connection states, top connecting IPs, listening services, and interface statistics in one organized display.
Port Scan Detector Script
bash
#!/bin/bash
# detect_scan.sh - Detect potential port scans

INTERFACE="eth0"
THRESHOLD=20  # SYN packets per minute from single IP

echo "Monitoring for port scans on $INTERFACE..."
echo "Threshold: $THRESHOLD SYN packets per minute"

sudo tcpdump -i $INTERFACE -n 'tcp[tcpflags] & (tcp-syn) != 0 and tcp[tcpflags] & (tcp-ack) == 0' 2>/dev/null | \
while read line; do
    IP=$(echo $line | awk '{print $3}' | cut -d. -f1-4)
    echo "$IP $(date +%s)" >> /tmp/scan_detect.tmp

    # Check last minute
    CUTOFF=$(($(date +%s) - 60))
    COUNT=$(awk -v ip="$IP" -v cutoff="$CUTOFF" '$1==ip && $2>cutoff' /tmp/scan_detect.tmp | wc -l)

    if [ $COUNT -gt $THRESHOLD ]; then
        echo "[ALERT] Possible port scan from $IP ($COUNT SYN packets in last minute)"
        # Optionally block:
        # sudo iptables -A INPUT -s $IP -j DROP
    fi
done
Bandwidth Alert Script
bash
#!/bin/bash
# bandwidth_alert.sh - Alert when bandwidth exceeds threshold

INTERFACE="eth0"
THRESHOLD_MBPS=800
DURATION=10

echo "Monitoring bandwidth on $INTERFACE"
echo "Alert threshold: ${THRESHOLD_MBPS}Mbps"

while true; do
    RESULT=$(iftop -i $INTERFACE -t -s $DURATION -n -N 2>/dev/null | grep "Total send and receive rate" | awk '{print $NF}')

    # Convert to Mbps (assuming input is in Mb)
    CURRENT=$(echo $RESULT | sed 's/[^0-9.]//g')

    if (( $(echo "$CURRENT > $THRESHOLD_MBPS" | bc -l) )); then
        echo "[ALERT] Bandwidth exceeded: ${CURRENT}Mbps > ${THRESHOLD_MBPS}Mbps"
        # Add notification logic here
    else
        echo "[OK] Current bandwidth: ${CURRENT}Mbps"
    fi

    sleep 30
done
Best Practices for CLI-Based Network Troubleshooting
Based on my experience working in data centers with Cisco and Huawei equipment, here are my recommendations:
1. Always Work in Screen or Tmux
When doing network troubleshooting remotely:
bash
# Start a screen session
screen -S troubleshooting

# Or use tmux
tmux new -s troubleshooting
This prevents losing your session if your SSH connection drops.
2. Log Everything
Create a timestamped log directory for each investigation:
bash
mkdir -p ~/investigations/$(date +%Y%m%d_%H%M%S)
cd ~/investigations/$(date +%Y%m%d_%H%M%S)

# Log all commands
script -a commands.log
3. Capture First, Analyze Later
Start packet capture immediately when investigating:
bash
sudo tcpdump -i eth0 -w initial_capture.pcap &
TCPDUMP_PID=$!

# Do your investigation...

# Stop capture when done
sudo kill $TCPDUMP_PID
4. Use Aliases for Common Commands
Add these to your ~/.bashrc:
bash
alias netconns='sudo netstat -tulpn'
alias netactive='sudo netstat -ant | grep ESTABLISHED'
alias netscan='sudo nmap -sS -p-'
alias pktcap='sudo tcpdump -i eth0 -w capture_$(date +%Y%m%d_%H%M%S).pcap'
alias bwmon='sudo iftop -i eth0 -nNP'
5. Document Your Findings
Keep a notes file during investigation:
bash
# investigation_notes.txt
echo "=== Investigation started: $(date) ===" >> notes.txt
echo "Issue: Unusual network activity reported" >> notes.txt
echo "" >> notes.txt

# Add findings as you go
echo "Finding: Multiple connections from 203.0.113.50" >> notes.txt
6. Security Considerations
- Never capture sensitive data unnecessarily - use capture filters
- Secure your captures - packet captures may contain sensitive information
- Limit retention - delete captures after analysis
- Use encryption - transfer captures over SCP, not unencrypted channels
bash
# Transfer capture securely
scp capture.pcap user@analysis-host:/secure/captures/

# Encrypt sensitive captures
gpg -c sensitive_capture.pcap
shred -u sensitive_capture.pcap  # Securely delete original
Conclusion and Next Steps
These five CLI tools - TShark, nmap, netstat, tcpdump, and iftop - have become absolutely essential in my daily work as a data center engineer. Since transitioning to Ubuntu and embracing the command-line workflow, I've become significantly more efficient at troubleshooting network issues, especially when working remotely.
The beauty of these CLI tools is that they:
- Work everywhere - Any Linux server with SSH access
- Are scriptable - Integrate into automation workflows
- Require minimal resources - No GUI overhead
- Provide deep insights - Direct access to network data
- Are battle-tested - Used by network engineers worldwide
What's Coming in Part 2
In the next installment of this series, we'll explore more advanced CLI tools:
- mtr & traceroute - Advanced path analysis and latency troubleshooting
- ss - The modern replacement for netstat with more powerful filtering
- ip command suite - Modern network configuration and management
- ethtool - Interface-level diagnostics and tuning
- iperf3 - Network performance testing
- nethogs - Per-process bandwidth monitoring
Practice Exercise for This Week
To get comfortable with these tools, try this hands-on exercise:
Day 1-2: Setup and Basic Usage
- Install all five tools on your Ubuntu system
- Practice basic commands for each tool
- Create the aliases mentioned in best practices
Day 3-4: Monitoring Your Own Network
- Use iftop to monitor your network for 1 hour
- Run nmap scan against your own devices (with permission!)
- Use netstat to identify all listening services
- Capture 10 minutes of traffic with tcpdump
Day 5-6: Analysis Practice
- Open your tcpdump capture with TShark
- Practice using different display filters
- Extract specific protocol statistics
- Create a simple report of your findings
Day 7: Integration
- Combine multiple tools to investigate a specific scenario
- Create one of the monitoring scripts mentioned above
- Set up automated monitoring on a test system
Resources for Further Learning
Man Pages - Your best friend:
bash
man tshark
man nmap
man netstat
man tcpdump
man iftop
Online Resources:
- Wireshark/TShark Documentation: https://www.wireshark.org/docs/
- Nmap Reference Guide: https://nmap.org/book/man.html
- Tcpdump Examples: https://danielmiessler.com/study/tcpdump/
Practice Environments:
- Set up lab environments using VirtualBox or VMware
- Practice in your own PNETLab or GNS3 setup
- Use controlled test environments before production
Final Thoughts
The transition from GUI tools to CLI-based troubleshooting might seem daunting initially, but the investment pays off tremendously. These tools have made me a more effective network engineer, whether I'm troubleshooting SD-WAN tunnels, investigating security incidents, or optimizing network performance.
The real power comes from understanding how to combine these tools. Each tool provides a different lens through which to view network behavior, and using them together gives you complete visibility into your network infrastructure.
Whether you're managing Cisco routers, Huawei switches, or Linux servers, these CLI tools will serve you well throughout your career. Master them, and you'll be equipped to handle virtually any network troubleshooting scenario from anywhere with just an SSH connection.
Stay tuned for Part 2 where we'll dive deeper into advanced CLI tools for network engineers!
About the Author: I'm a data center engineer specializing in SD-WAN deployments and working extensively with Cisco and Huawei networking equipment. I transitioned from Windows to Ubuntu for my daily work and have embraced CLI-based workflows. Follow my technical journey and insights at tawkirjournal.com.